はじめに
因果探索といえば、最近流れが来ているような、来ていないような微妙な手法ですが、因果推論の流れが来ていることを考えると、計算コストの問題などを解決すれば、意外と流行るのではないかと思い、この記事を書くことにしました。タイトルの通り、因果の強度だけでなく、変数Xが1変化したら変数Yが何変化するのかのような直接効果の算出ができるようにすることは、実務上のキャッチーさとして意外と需要があるのではないかと思ったので、実装にこの要件を含むこととしました。
また、SEMをベースにする理由は、計算効率的な観点から計算コストを減らすために、LiNGAMやベイジアンネットワークなどではなく、SEMをベースとすることにしています。まずは、理論面から内容に入っていきましょう。
SEMCausalExplorerOneHot の理論的背景
1. はじめに
本ドキュメントでは、クラス
SEMCausalExplorerOneHot が内包する理論的背景について解説します。従来の構造方程式モデリング(SEM)では因果方向があらかじめ固定されていましたが、本手法は動的に因果方向を探索できるよう拡張した枠組みを採用します。以下では、その理論的基盤となる数式や目的関数、推定アルゴリズムなどを紹介します。2. SEM の拡張的フレームワーク
ここで、 は変数
は変数  から変数
から変数  への影響を表し、
 はパス係数(因果強度)、
 は方向性パラメータ、
 は説明変数、
 は誤差項を示します。 が「因果の向き」を含む連続的な値を持つことで、SEMを拡張しつつ自動で因果方向を推定する枠組みが構成されています。
3. 目的関数の定式化
ここではスパース正則化を導入しています。 ,
,  はそれぞれ、パス係数と方向性パラメータに対する正則化項の重みです。
不要な経路 を抑制しつつ、方向性パラメータ も同様に推定し、方向があいまいな経路を削減する効果があります。
不要な経路
4. 方向性パラメータ
いわば川の流れを表すように、
5. 収束性の保証
この不等式により、十分なサンプルサイズを用意した場合、推定されたパラメータ  が真のパラメータ
  に近づく確率が高いことを示します。
データ量が多いほど、誤差 の範囲内で推定が行える「信頼度が上がる」というイメージです。
データ量が多いほど、誤差
6. 推定アルゴリズム
これは勾配降下法において、更新量を徐々に調整しながら最適解に近づいていく一般的な手法です。
SEMCausalExplorerOneHot では、フリップ試行やスコア計算(AIC/BIC)といったステップを組み合わせ、徐々により良い因果構造を探索しています。
7. 因果強度の定量化
8. 間接効果の計算
媒介変数を経由する経路(間接経路)の効果を合算したものが間接効果です。
たとえば、 →  → のように、一度 を介して伝わる影響を考慮する場合、上式のように各経路の強度を合計することで間接的な因果影響を推定できます。
たとえば、
9. 不確実性の評価
10. モデル選択基準
SEMCausalExplorerOneHot では、フリップ試行による構造探索と同時にこの基準を計算し、最終的に最も評価の高い因果構造を採用します。
実装
import numpy as np import pandas as pd import plotly.graph_objects as go import warnings warnings.filterwarnings("ignore") # Dask for parallel (ローカルin-process) import dask import dask.array as da from dask import delayed from sklearn.linear_model import Lasso, LogisticRegression from sklearn.metrics import log_loss def is_cyclic(adjacency): """ adjacency[i,j] = True => i->j DFSで巡回(サイクル)があるか判定 (Trueなら循環あり) """ d = adjacency.shape[0] visited = np.zeros(d, dtype=int) def dfs(u): if visited[u] == 1: return True if visited[u] == 2: return False visited[u] = 1 for v in range(d): if adjacency[u,v]: if dfs(v): return True visited[u] = 2 return False for i in range(d): if visited[i]==0: if dfs(i): return True return False @delayed def try_flip(X, adjacency_in, i, j, score_before, var_types, alpha, solver_iter, criterion): """ (i,j) のフリップを試し、新しい adjacency を生成し、サイクル or スコア悪化ならNG. 戻り値: (flip_ok, new_score, new_adj) adjacency_in: numpy配列(bool) (immutable想定) """ adj_copy = adjacency_in.copy() if adj_copy[i,j]: adj_copy[i,j] = False adj_copy[j,i] = True else: adj_copy[j,i] = False adj_copy[i,j] = True # フリップ後に巡回があれば不採用 if is_cyclic(adj_copy): return (False, score_before, adjacency_in) coef_local = estimate_sem_params_local(X, adj_copy, var_types, alpha, solver_iter) score_flip = model_score_local(X, adj_copy, coef_local, criterion) # スコア悪化も不採用 if score_flip > score_before: return (False, score_before, adjacency_in) else: return (True, score_flip, adj_copy) def estimate_sem_params_local(X, adjacency, var_types, alpha, solver_iter): """ adjacency[i,j] => i->j binary => logistic-l1(要{0,1}), それ以外=> lasso(continuous) """ d= adjacency.shape[0] out= {} for j in range(d): parents= np.where(adjacency[:, j])[0] if len(parents)==0: out[j]= { "parents": [], "coef": None, "intercept": None, "type": var_types[j] } continue Xp= X[:, parents] y= X[:, j] vtype= var_types[j] # binaryチェック if vtype == "binary": unq= np.unique(y) if len(unq)>2 or not set(unq).issubset({0,1}): # fallback => continuous vtype="continuous" else: y= y.astype(int) if vtype=="continuous": model= Lasso(alpha=alpha, fit_intercept=True, max_iter=solver_iter, random_state=0) model.fit(Xp,y) out[j]= { "parents": parents, "coef": model.coef_, "intercept": model.intercept_, "type": "continuous" } elif vtype=="binary": # logistic-l1 Cval= 1.0/alpha if alpha>0 else 1e5 model= LogisticRegression( penalty='l1', solver='liblinear', C=Cval, max_iter=solver_iter, random_state=0 ) model.fit(Xp,y) out[j]= { "parents": parents, "coef": model.coef_[0], "intercept": model.intercept_[0], "type": "binary" } else: # fallback => continuous model= Lasso(alpha=alpha, fit_intercept=True, max_iter=solver_iter, random_state=0) model.fit(Xp,y) out[j]= { "parents": parents, "coef": model.coef_, "intercept": model.intercept_, "type": "continuous" } return out def model_score_local(X, adjacency, coef_dict, criterion): n, d= X.shape loglik=0.0 n_params=0 for j in range(d): info= coef_dict[j] ps= info["parents"] if len(ps)==0: continue c= info["coef"] intercept= info["intercept"] vtype= info["type"] Xp= X[:, ps] y= X[:, j] if vtype=="continuous": yhat= Xp@c + intercept sse= np.sum((y-yhat)**2) sigma2= sse/n if sigma2<1e-12: sigma2=1e-12 ll_j= - (n/2)*( np.log(2*np.pi*sigma2)+1 ) loglik+= ll_j n_params+= len(c)+2 elif vtype=="binary": z= Xp@c + intercept p_= 1/(1+ np.exp(-z)) nll= log_loss(y, p_, labels=[0,1]) ll_j= - n*nll loglik+= ll_j n_params+= len(c)+1 else: yhat= Xp@c + intercept sse= np.sum((y-yhat)**2) sigma2= sse/n if sigma2<1e-12: sigma2=1e-12 ll_j= - (n/2)*(np.log(2*np.pi*sigma2)+1) loglik+= ll_j n_params+= len(c)+2 if criterion=="aic": score= -2*loglik + 2*n_params else: score= -2*loglik + n_params*np.log(n) return score class SEMCausalExplorerOneHot: def __init__( self, criterion="bic", alpha=0.01, max_iter=30, solver_iter=500, random_state=42, dask_scheduler="threads" ): self.criterion = criterion self.alpha = alpha self.max_iter = max_iter self.solver_iter = solver_iter self.random_state = random_state self.dask_scheduler = dask_scheduler # "threads" or "synchronous" self.df_encoded_ = None self.feature_names_ = None self.n_features_ = None self.var_types_ = None self.adjacency_ = None self.coef_dict_ = {} def _preprocess(self, df): df_clean = df.dropna(axis=0) bin_cols= [] cat_cols= [] cont_cols= [] for col in df_clean.columns: if pd.api.types.is_numeric_dtype(df_clean[col]): unique_vals= df_clean[col].unique() if len(unique_vals)==2 and set(unique_vals)=={0,1}: bin_cols.append(col) else: cont_cols.append(col) else: cat_cols.append(col) multi_cols= [] normal_cont_cols= [] for col in cont_cols: unq= df_clean[col].unique() if df_clean[col].dtype in [int, np.integer] and len(unq)>2: multi_cols.append(col) else: normal_cont_cols.append(col) df_encoded_multi= pd.DataFrame(index=df_clean.index) if multi_cols: df_to_encode= df_clean[multi_cols] if df_to_encode.shape[1]>0: df_encoded_multi= pd.get_dummies(df_to_encode, prefix=multi_cols, drop_first=False) df_encoded_cat= pd.DataFrame(index=df_clean.index) if cat_cols: df_cat= df_clean[cat_cols] if df_cat.shape[1]>0: df_encoded_cat= pd.get_dummies(df_cat, drop_first=False) df_remain= df_clean[bin_cols + normal_cont_cols] df_final= pd.concat([df_remain, df_encoded_multi, df_encoded_cat], axis=1) # floatにそろえる => np.exp等でエラー回避 df_final= df_final.astype(float) var_types= [] for c in df_final.columns: unq= df_final[c].unique() if len(unq)==2 and set(unq)=={0.0,1.0}: var_types.append("binary") else: var_types.append("continuous") self.df_encoded_= df_final self.feature_names_= df_final.columns.tolist() self.n_features_= len(self.feature_names_) self.var_types_= var_types return df_final def fit(self, df): df_encoded= self._preprocess(df) X= df_encoded.values d= X.shape[1] rng= np.random.default_rng(self.random_state) adjacency= np.zeros((d,d), dtype=bool) # ここを修正:ランダムなトポロジカル順序に基づいて初期DAGを生成 perm = rng.permutation(d) for idx_i in range(d): for idx_j in range(idx_i+1, d): i = perm[idx_i] j = perm[idx_j] # 50%の確率で i->j を生成 (逆方向は張らない) if rng.uniform()<0.5: adjacency[i,j]= True # 念のため初期化段階で循環がないかチェック assert not is_cyclic(adjacency), "初期化段階で巡回が発生しました(想定外)." best_score= np.inf best_adj= adjacency.copy() best_coef= {} old_adj= adjacency.copy() for iteration in range(self.max_iter): local_coef= estimate_sem_params_local(X, adjacency, self.var_types_, self.alpha, self.solver_iter) score_curr= model_score_local(X, adjacency, local_coef, self.criterion) if score_curr< best_score: best_score= score_curr best_adj= adjacency.copy() best_coef= local_coef tasks= [] pairs= [] for i2 in range(d): for j2 in range(i2+1,d): # どちらか一方だけ辺がある場合にのみフリップ試行 if adjacency[i2,j2] == adjacency[j2,i2]: continue adj_in= adjacency.copy() t= try_flip( X, adj_in, i2, j2, score_curr, self.var_types_, self.alpha, self.solver_iter, self.criterion ) tasks.append(t) pairs.append((i2,j2)) # Daskで並列実行 results= dask.compute(*tasks, scheduler=self.dask_scheduler) changed=0 for (flip_ok, new_score, new_adj), (i2,j2) in zip(results, pairs): if flip_ok: changed+=1 score_curr= new_score adjacency= new_adj diff= np.sum(adjacency!= old_adj) if diff==0: # もう更新がなければ打ち切り break old_adj= adjacency.copy() # 学習終了 => ベスト確定 self.adjacency_= best_adj self.coef_dict_= best_coef # 念のため最終的なグラフに循環がないかチェック assert not is_cyclic(self.adjacency_), "最終的なグラフに循環が発生しています。" return self def plot_causal_graph(self, threshold=0.01, radius_scale=2.0, fig_width=900, fig_height=900): if self.adjacency_ is None: raise RuntimeError("Model not fitted yet.") d= self.n_features_ angle_step= 2*np.pi/d positions= [ (radius_scale*np.cos(i*angle_step), radius_scale*np.sin(i*angle_step)) for i in range(d) ] node_x= [p[0] for p in positions] node_y= [p[1] for p in positions] node_trace= go.Scatter( x=node_x, y=node_y, mode='markers+text', text=self.feature_names_, textposition='bottom center', marker=dict(size=20, color='lightblue', line=dict(color='black', width=1)), hoverinfo='text' ) annotations=[] edge_list = [] for j, info in self.coef_dict_.items(): ps= info["parents"] if ps is None or len(ps)==0: continue c= info["coef"] if c is None: continue vtype= info["type"] abscoef= np.abs(c) if c.ndim==1 else np.abs(c.ravel()) for ip, par in enumerate(ps): strength= abscoef[ip] edge_list.append({ "source": self.feature_names_[par], "target": self.feature_names_[j], "coefficient": c[ip], "vtype": vtype }) if strength< threshold: continue x0, y0= positions[par] x1, y1= positions[j] annotations.append( dict( x=x1, y=y1, ax=x0, ay=y0, xref='x', yref='y', axref='x', ayref='y', text="", showarrow=True, arrowhead=3, arrowwidth=2, arrowcolor='#555', standoff=5 ) ) mx= (x0+x1)/2 my= (y0+y1)/2 dx= x1-x0 dy= y1-y0 length= np.sqrt(dx*dx+ dy*dy)+1e-12 nx= -dy/ length ny= dx/ length offset_scale= 0.07 ox= mx+ offset_scale*nx oy= my+ offset_scale*ny annotations.append( dict( x= ox, y= oy, xref='x', yref='y', showarrow=False, text= f"{c[ip]:.3f}", font=dict(color="#333", size=12) ) ) fig= go.Figure( data=[node_trace], layout=go.Layout( title="Estimated Causal Graph", showlegend=False, xaxis=dict(showgrid=False, zeroline=False, showticklabels=False), yaxis=dict(showgrid=False, zeroline=False, showticklabels=False), margin=dict(l=40, r=40, b=40, t=80), width=fig_width, height=fig_height, annotations=annotations ) ) fig.show() edge_df = pd.DataFrame(edge_list) if not edge_df.empty: print("=== Causal Edges with Coefficients ===") display(edge_df) edge_df.to_csv("Causal_Edges.csv", index=False) else: print("No edges with coefficient above the threshold.") def simulate_intervention(self, df, from_idx, delta=1.0, steps=5): if self.adjacency_ is None: raise RuntimeError("Model not fitted yet.") df_enc= self.df_encoded_.dropna(axis=0) X_= df_enc.values baseline= X_.mean(axis=0) new_values= baseline.copy() new_values[from_idx]+= delta d= self.n_features_ for _ in range(steps): updated= False for j in range(d): info= self.coef_dict_[j] ps= info["parents"] if len(ps)==0: continue c= info["coef"] intercept= info["intercept"] vtype= info["type"] old_val= new_values[j] pvals= new_values[ps] if vtype=="continuous": val= intercept+ np.sum(c*pvals) new_values[j]= val elif vtype=="binary": z= intercept+ np.sum(c*pvals) p_= 1/(1+ np.exp(-z)) new_values[j]= p_ else: val= intercept+ np.sum(c*pvals) new_values[j]= val if abs(old_val- new_values[j])>1e-8: updated= True if not updated: break return baseline, new_values def plot_intervention_result( self, df, from_idx, delta=1.0, steps=5, threshold=0.01, radius_scale=2.0, fig_width=900, fig_height=900 ): baseline, new_val= self.simulate_intervention(df, from_idx, delta, steps) diff= new_val- baseline d= self.n_features_ angle_step= 2*np.pi/d positions= [ (radius_scale*np.cos(i*angle_step), radius_scale*np.sin(i*angle_step)) for i in range(d) ] node_x= [p[0] for p in positions] node_y= [p[1] for p in positions] node_color= diff node_labels= [] for i, nm in enumerate(self.feature_names_): node_labels.append(f"{nm}\n(Δ={diff[i]:.3f})") node_trace= go.Scatter( x=node_x, y=node_y, mode='markers+text', text=node_labels, textposition='bottom center', marker=dict( colorscale='RdBu', cmin=node_color.min(), cmax=node_color.max(), color=node_color, size=25, showscale=True, colorbar=dict(title="Change") ), hoverinfo='text' ) annotations=[] for j, info in self.coef_dict_.items(): ps= info["parents"] if ps is None or len(ps)==0: continue c= info["coef"] if c is None: continue vtype= info["type"] abscoef= np.abs(c) if c.ndim==1 else np.abs(c.ravel()) for ip, par in enumerate(ps): strength= abscoef[ip] if strength< threshold: continue x0, y0= positions[par] x1, y1= positions[j] annotations.append( dict( x=x1, y=y1, ax=x0, ay=y0, xref='x', yref='y', axref='x', ayref='y', text="", showarrow=True, arrowhead=3, arrowwidth=2, arrowcolor='#555', standoff=5 ) ) mx= (x0+x1)/2 my= (y0+y1)/2 dx= x1-x0 dy= y1-y0 length= np.sqrt(dx*dx+ dy*dy)+1e-12 nx= -dy/ length ny= dx/ length offset_scale= 0.07 ox= mx+ offset_scale*nx oy= my+ offset_scale*ny annotations.append( dict( x=ox, y=oy, xref='x', yref='y', showarrow=False, text=f"{c[ip]:.3f}", font=dict(color="#333", size=12) ) ) fig= go.Figure( data=[node_trace], layout=go.Layout( title=f"Intervention on {self.feature_names_[from_idx]} +{delta}", showlegend=False, xaxis=dict(showgrid=False, zeroline=False, showticklabels=False), yaxis=dict(showgrid=False, zeroline=False, showticklabels=False), margin=dict(l=40,r=40,b=40,t=80), width=fig_width, height=fig_height, annotations=annotations ) ) fig.show() result_df = pd.DataFrame({ "Feature": self.feature_names_, "Baseline": baseline, "New Values": new_val, "Diff": diff }) print("=== Intervention Result ===") display(result_df) result_df.to_csv("intervention_Result.csv", index=False)
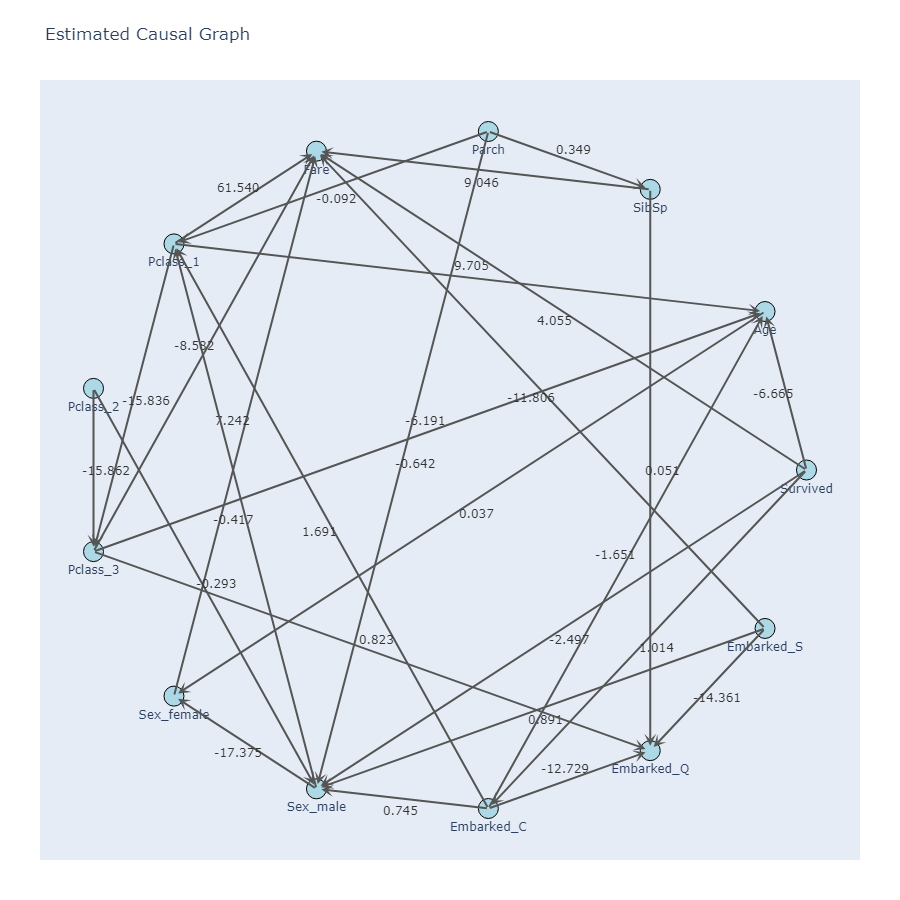
タイタニックのデータで因果グラフを作ってみた結果が以下です。
df = pd.read_csv("train.csv")
df = df[["Survived", "Pclass", "Sex", "Age", "SibSp", "Parch", "Fare", "Embarked"]]
df["Pclass"] = df["Pclass"].astype("str")

model= SEMCausalExplorerOneHot(
    criterion="bic",
    alpha=0.05,
    max_iter=15,
    solver_iter=300,
    random_state=42,
    # ローカルスレッドで計算(分散クラスターを立ち上げない)
    dask_scheduler="threads"
)
model.fit(df)
model.plot_causal_graph(threshold=0.02)

from_idx= 1
model.plot_intervention_result(df, from_idx= from_idx, delta=1.0, steps=5, threshold=0.02)
 ageを1変化させたときの他の変数の変化は以下です
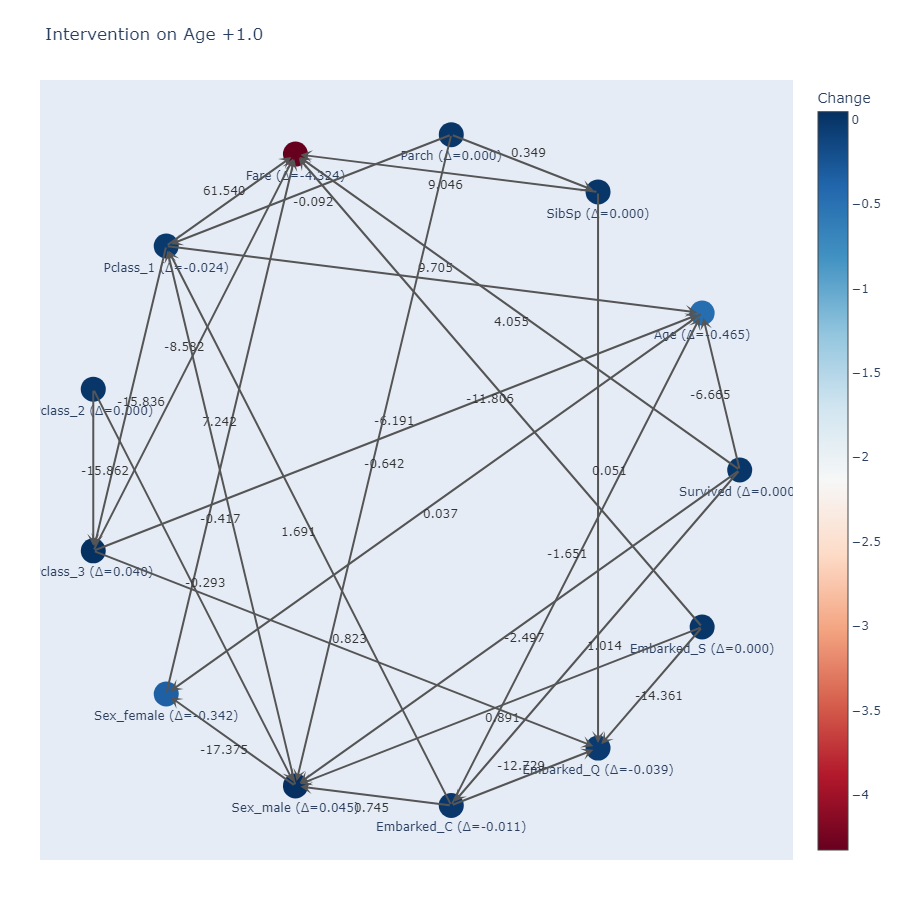 このように実際に因果探索を行わせてみると、エッジの方向がドメイン知識と明らかに異なっている部分は出てきてしまっていますが、ageを1変化させたときの他の変数の変化は一定納得がいく部分も一部アリといった感じです。
まとめ
以上のように、
さらに、Dask を用いた並列計算を組み合わせることで大規模データでも効率的に因果構造を推定できるよう工夫されています。
このような理論的背景のもと、得られたモデルは循環がなく、かつ適切な方向を持つ DAG 構造として表現されます。
SEMCausalExplorerOneHot では、拡張された SEM の枠組みに基づいて因果方向を自動的に探索し、スパース推定や情報量基準の活用によって不要な経路を削除しながら学習を行います。さらに、Dask を用いた並列計算を組み合わせることで大規模データでも効率的に因果構造を推定できるよう工夫されています。
このような理論的背景のもと、得られたモデルは循環がなく、かつ適切な方向を持つ DAG 構造として表現されます。
SEMをベースにしていることや、二値を扱えたり、多クラス変数を扱えるようにしている部分で、DAGの厳密性などを満たす処理が実装できなかったので、どんなデータでも扱えるようにという制約を外せば、もっと厳密性のあるDAGを生成できるクラスが作れそうでした。
ということで今回の結果は、分析の初手に回してみる程度であれば有用なのかな?と感じる程度の手ごたえでした。